ECG Review: Pulmonary Pattern and What Else?
September 1, 2003
By Ken Grauer, MD
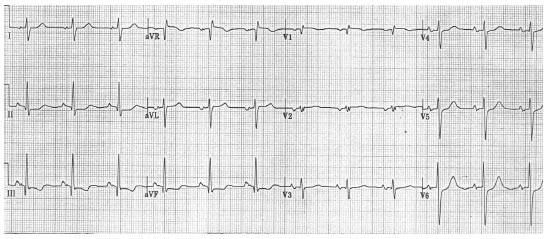
Figure. 12-lead ECG obtained from a 78-year-old man with long-standing
pulmonary disease and new-onset heart failure.
Clinical Scenario: The ECG in the Figure was obtained from a 78-year-old man with long-standing pulmonary disease and new-onset heart failure. Based on the low voltage in leads V1, V2, V3, the rightward frontal plane axis, incomplete right bundle-branch block (RBBB), and persistent precordial S waves, the computer interpreted the overall pattern as consistent with pulmonary disease. What else should be added to your interpretation?
Interpretation: The ECG diagnosis of right ventricular hypertrophy (RVH) in adults is often quite difficult to make. This is because the electrocardiogram represents a balance of electrical forces between the left and right ventricles at any given instant in time. The much larger and thicker left ventricle usually accounts for a predominance of these electrical forces, even when there is clinical evidence of mild-to-moderate pulmonary disease. In contrast to what occurs in children, in whom much lesser degrees of RVH are needed to produce a predominance of right-sided forces (seen on ECG as a dominant R wave in lead V1), it is only with more severe degrees of RVH and/or pulmonary hypertension that definite ECG criteria for this diagnosis usually are seen. Suspicion for long-standing pulmonary disease (with possible RVH/pulmonary hypertension) should, therefore, be raised by the combined ECG findings of rightward axis, incomplete RBBB, low voltage in several precordial leads, and persistent precordial S waves in leads V4, V5, V6—even in the absence of a tall R wave in lead V1 and ECG criteria for right atrial enlargement. Although the ST-T wave changes in the inferior leads of the tracing seen here may indeed reflect right-sided "strain" (from RVH), it is important to emphasize that these changes also could reflect ischemia. This point is especially relevant in this patient with new-onset heart failure. However, an even more worrisome finding on this tracing is the subtle but definitely present coved ST segment elevation in lead V1. The patient in this case died from acute myocardial infarction. ECG changes from long-standing pulmonary disease were felt to "mask" ECG evidence of the large acute infarction that was evolving with the exception of the above noted subtle ST segment changes in the inferior leads and in lead V1.
Dr. Grauer, Professor and Associate Director, Family Practice Residency Program, Department of Community Health and Family Medicine, College of Medicine, University of Florida, Gainesville, is on the Editorial Board of Emergency Medicine Alert.