Acute STEMI or Something Else?
August 15, 2025
By Ken Grauer, MD
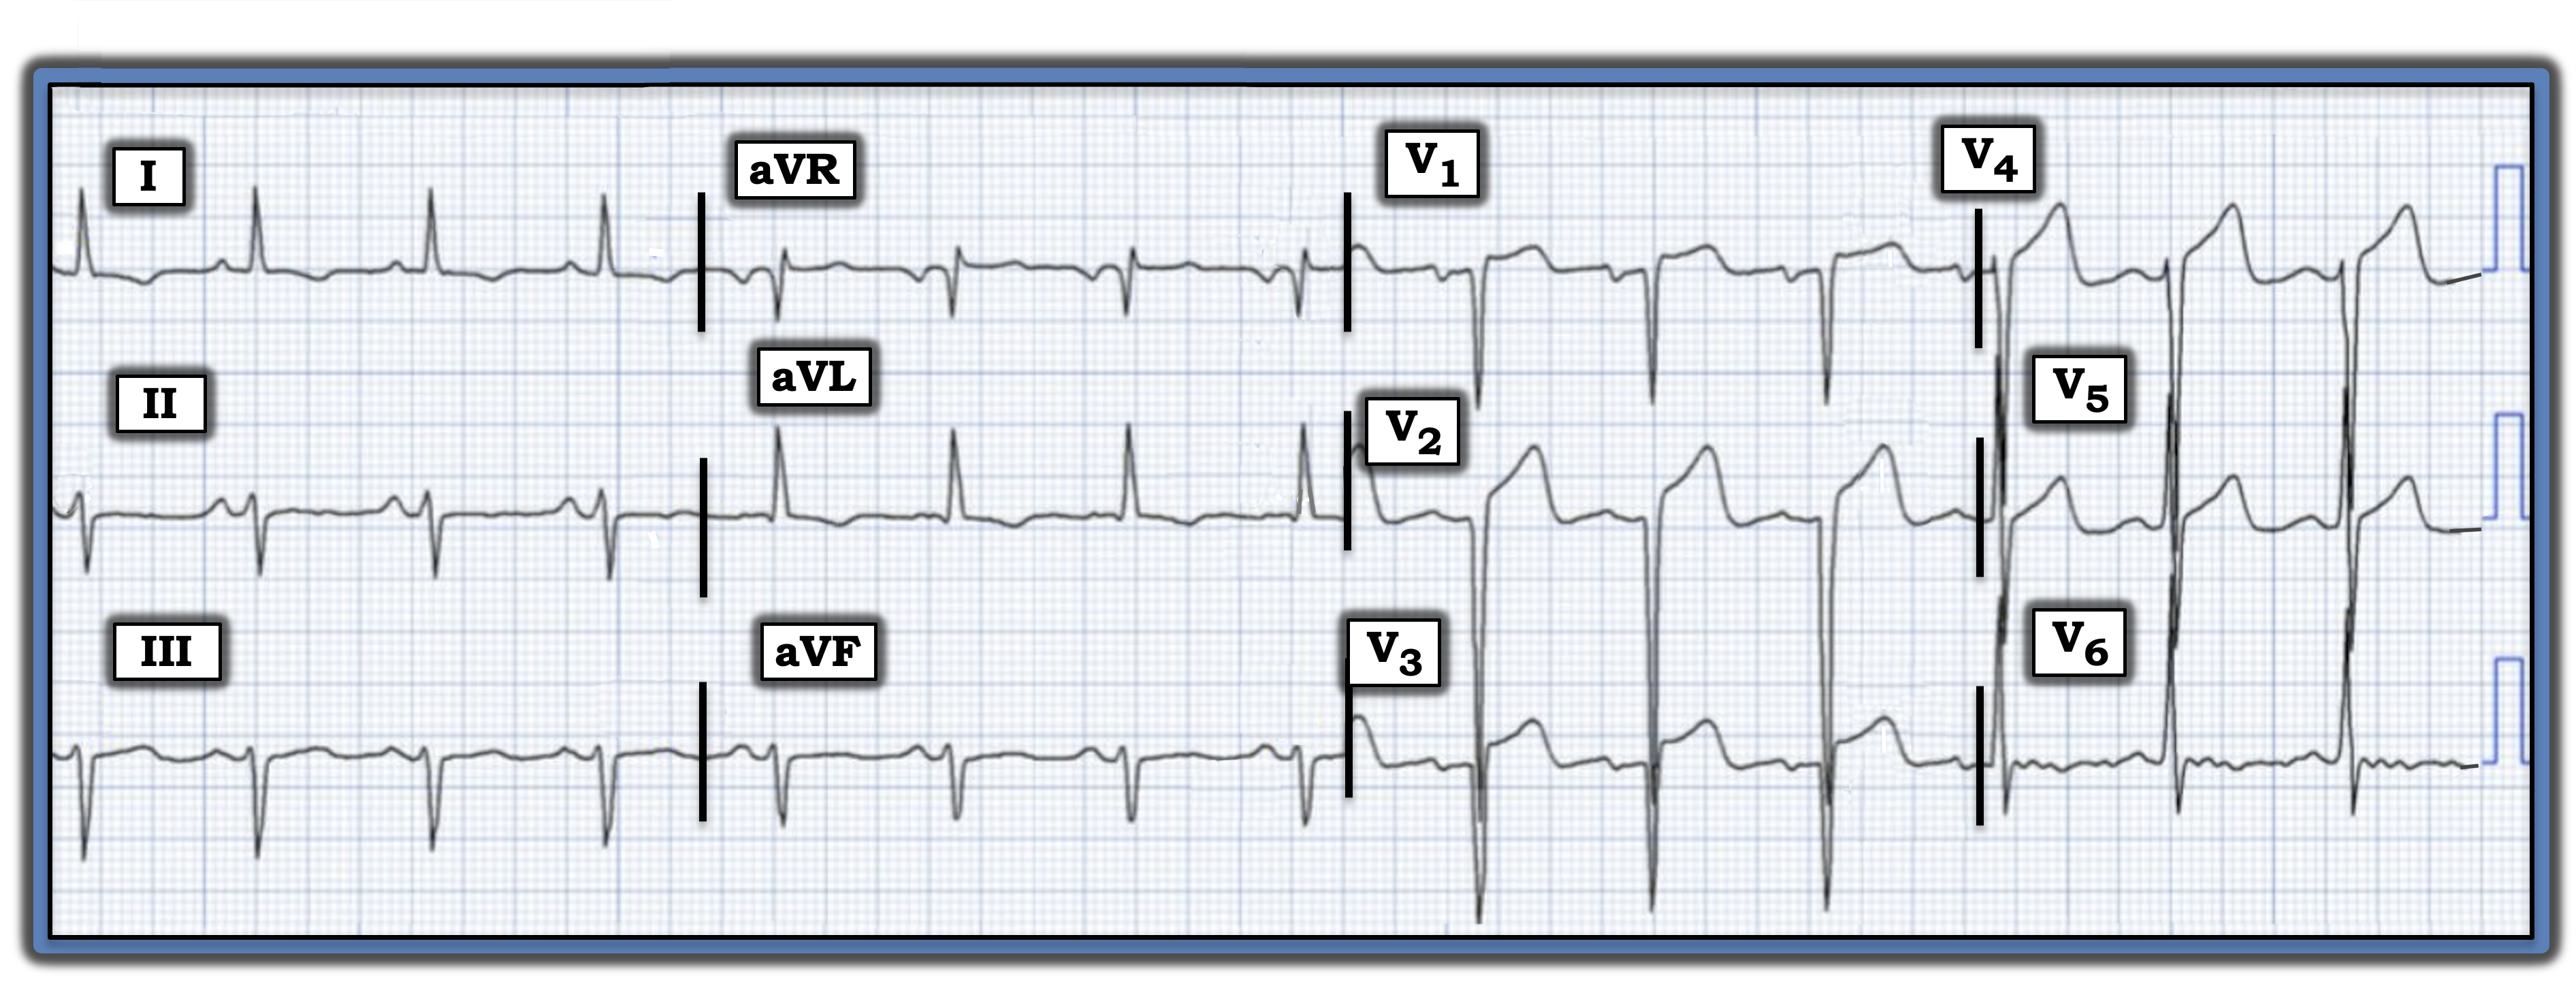
I was asked to interpret the electrocardiogram (ECG) in the figure without the benefit of any clinical information. Is this ECG indicative of an acute anterior ST-elevation myocardial infarction (STEMI)?
Interpretation: It is best to systematically interpret this ECG before contemplating diagnostic possibilities:
- The rhythm is sinus at ~85/minute.
- Regarding intervals, the PR interval is normal, the QRS is narrow, and the QTc interval is at most of borderline duration.
- The frontal plane axis is decidedly leftward, consistent with a left anterior hemiblock.
The most remarkable findings are in the chest leads.
- The QRS amplitude is markedly increased, so much so that there is overlap of QRS complexes in multiple leads. This makes precise calculation of QRS amplitudes extremely challenging, since it is difficult to determine the depth of S waves in leads V2, V4, and V5 and equally difficult to determine the height of R waves in leads V3, V5, and V6. Suffice it to say that voltage criteria for left ventricular hypertrophy (LVH) are easily satisfied.
- QS waves appear to be present in leads V1, V2, and V3 — with no more than a tiny initial R wave in lead V4.
- R wave progression is delayed, with transition (where the R wave becomes taller than the S wave is deep) not occurring until between leads V5 and V6.
- ST elevation is present to some degree in leads V1 through V5, attaining at least 2 mm in leads V2 and V3.
- Elsewhere, there is nonspecific ST-T wave flattening in the limb leads and in lead V6.
Impression: Interpretation of today’s ECG is clearly made more challenging by the absence of clinical information.
- The presence of QS waves in leads V1 through V3 — in association with ST elevation in the first five chest leads — raises concern about acute infarction.
- That said, the chest lead voltage is so markedly increased that the relative amount of ST elevation does not appear to be disproportionate, considering how deep chest lead S waves are.
- Instead of overly tall R waves, LVH sometimes manifests on ECG as extremely deep anterior S waves, in which case ST-T wave abnormalities of left ventricular “strain” may manifest as anterior lead ST elevation. In such cases, posterior forces from LVH may predominate, negating production of anterior R waves.
Bottom line: My differential diagnosis for the noted findings included anterior STEMI; marked LVH; prior anterior infarction, now with left ventricular aneurysm; LVH, now with superimposed changes of acute infarction. I suspected the ST elevation in today’s case was not acute — but without knowing the history (and without seeing a previous ECG for comparison) — I could not be certain.
Postscript: It turned out that this patient did not have acute chest pain. Instead, he was strikingly hypertensive — and previous ECGs showed a similar picture, with all ECG findings attributed to longstanding LVH.
For more information about this case, visit https://tinyurl.com/KG-Blog-461.
Ken Grauer, MD, is Professor Emeritus in Family Medicine, College of Medicine, University of Florida, Gainesville.